Reports in ReadiTrak™
Enhanced Visibility and Accountability
The reporting module in ReadiTrak™ provides executives and managers with a comprehensive and flexible view of numerous metrics including equipment status, repair history, long-term operational availability and costs of any item or group of items in your inventory. ReadiTrak reports allows end-users to print or save data related to their specific instruments and supervisors to monitor multiple types of equipment belonging to multiple users.
Each report displays a graphical representation of equipment data based on user-defined report types and filters. A detailed table of all data used to generate the report appears below the graph. Reports may be printed or exported to a spreadsheet or PDF document for further manipulation or integration into other documents and systems. Secure access to reports can be specified on a per-customer and per-user-group basis.
Key Report Types
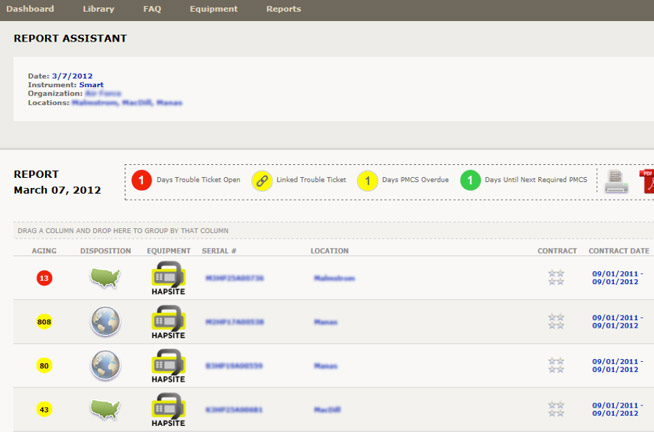
The status report shows a listing of equipment based on whether it is ready, unknown, or down. The date filter on this report allows a user to view the status on today’s date or on any single date in the past. Additionally, this report can be filtered to show the status based on instrument model, location, grouping or ready state.

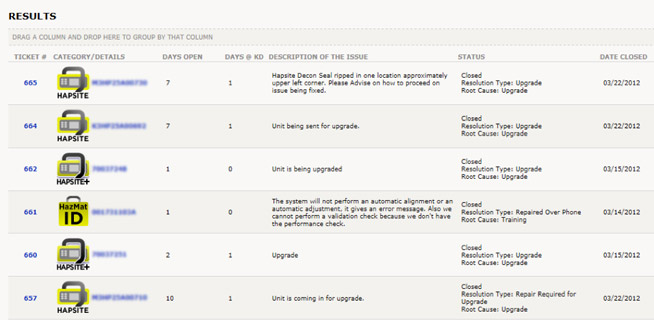
The trouble ticket report provides a list of trouble tickets including the ticket status and resolution data. This report is ideal for measuring instrument down time and can be generated for any date range. In addition, the report can be filtered by location, trouble ticket number, instrument model or serial number, resolution type and root cause type. The details for each trouble ticket can be accessed by clicking on the ticket number.

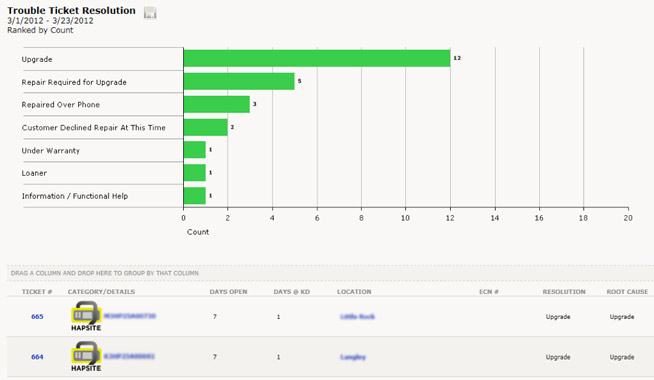
The resolution and root cause reports allow users to see a detailed representation of how instrument problems are being resolved and why the problems are occurring. Specific resolution and root causes are provided by the customers and then entered into the ReadiTrak setup. Each trouble ticket is assigned a resolution type and root cause upon closure. Both of these reports can be filtered by date range, location or instrument to provide a more specific analysis of trouble ticket closure.

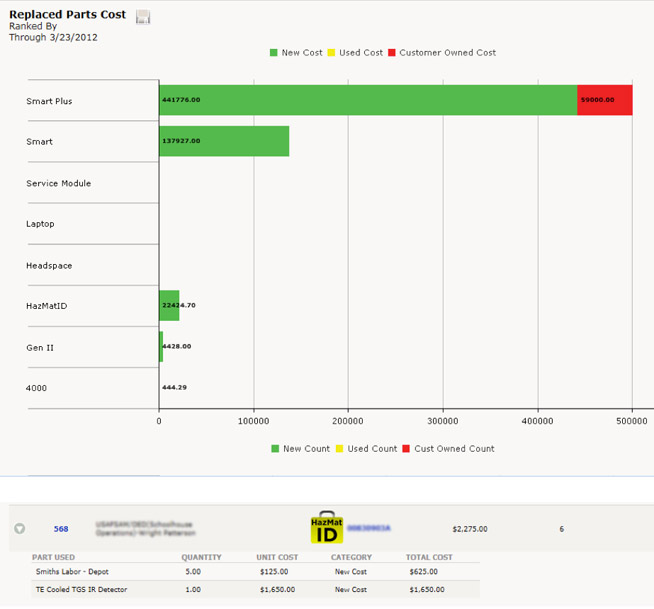
There are three cost report variations. These are parts and cost by part type, cost by location, and part by location. All three reports can be filtered by date range, location, and instrument model. In addition, the results can be sorted so that the graph returns the results ordered by cost or count. The trouble ticket listings under each graph provide detailed access into which parts were used on each trouble ticket.

Other reports on ReadiTrak include those displaying the time associated with each repair action, the average cost per trouble ticket repair, and the cost of shipping for each instrument. Additional reporting capabilities will be added as ReadiTrak evolves to include such items as lifecycle, inventory, and consumables tracking.


